Before input data into hydrologic or hydraulic data, we need to know the catchment boundary first. Arcmap has wonderful tool suite to proceed this
The basic step flow is as below:
dem-- fill–flow direction–flow accumulation–raster calculator or reclassify --stream link–watershed
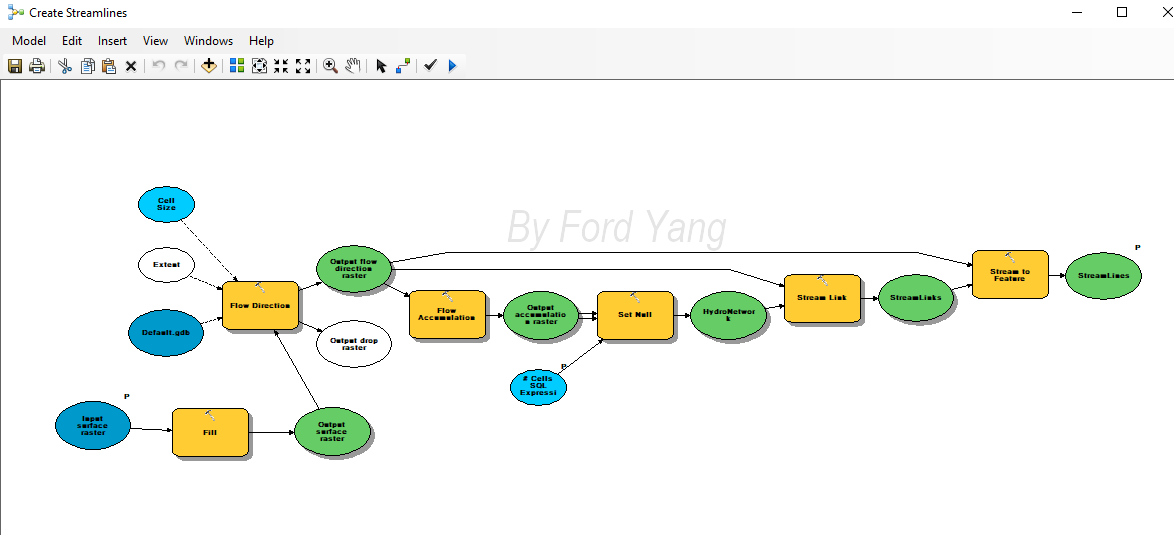
After knowing the basic workflow, we can generate our own defined workflow by Model Builder in ArcGIS as the figure below, or we can use the existing tool, for example, ArcHydro. However, we should know how to achieve it by ArcMAP first to understand the basic theory.
Fill
Firstly, we need to load the DEM raster files into ArcMAP, and then select fill tool as followed:Arctool boxes/spatial Analyst Tools/Hydrology/Fill
The window as followed figure will pop out:
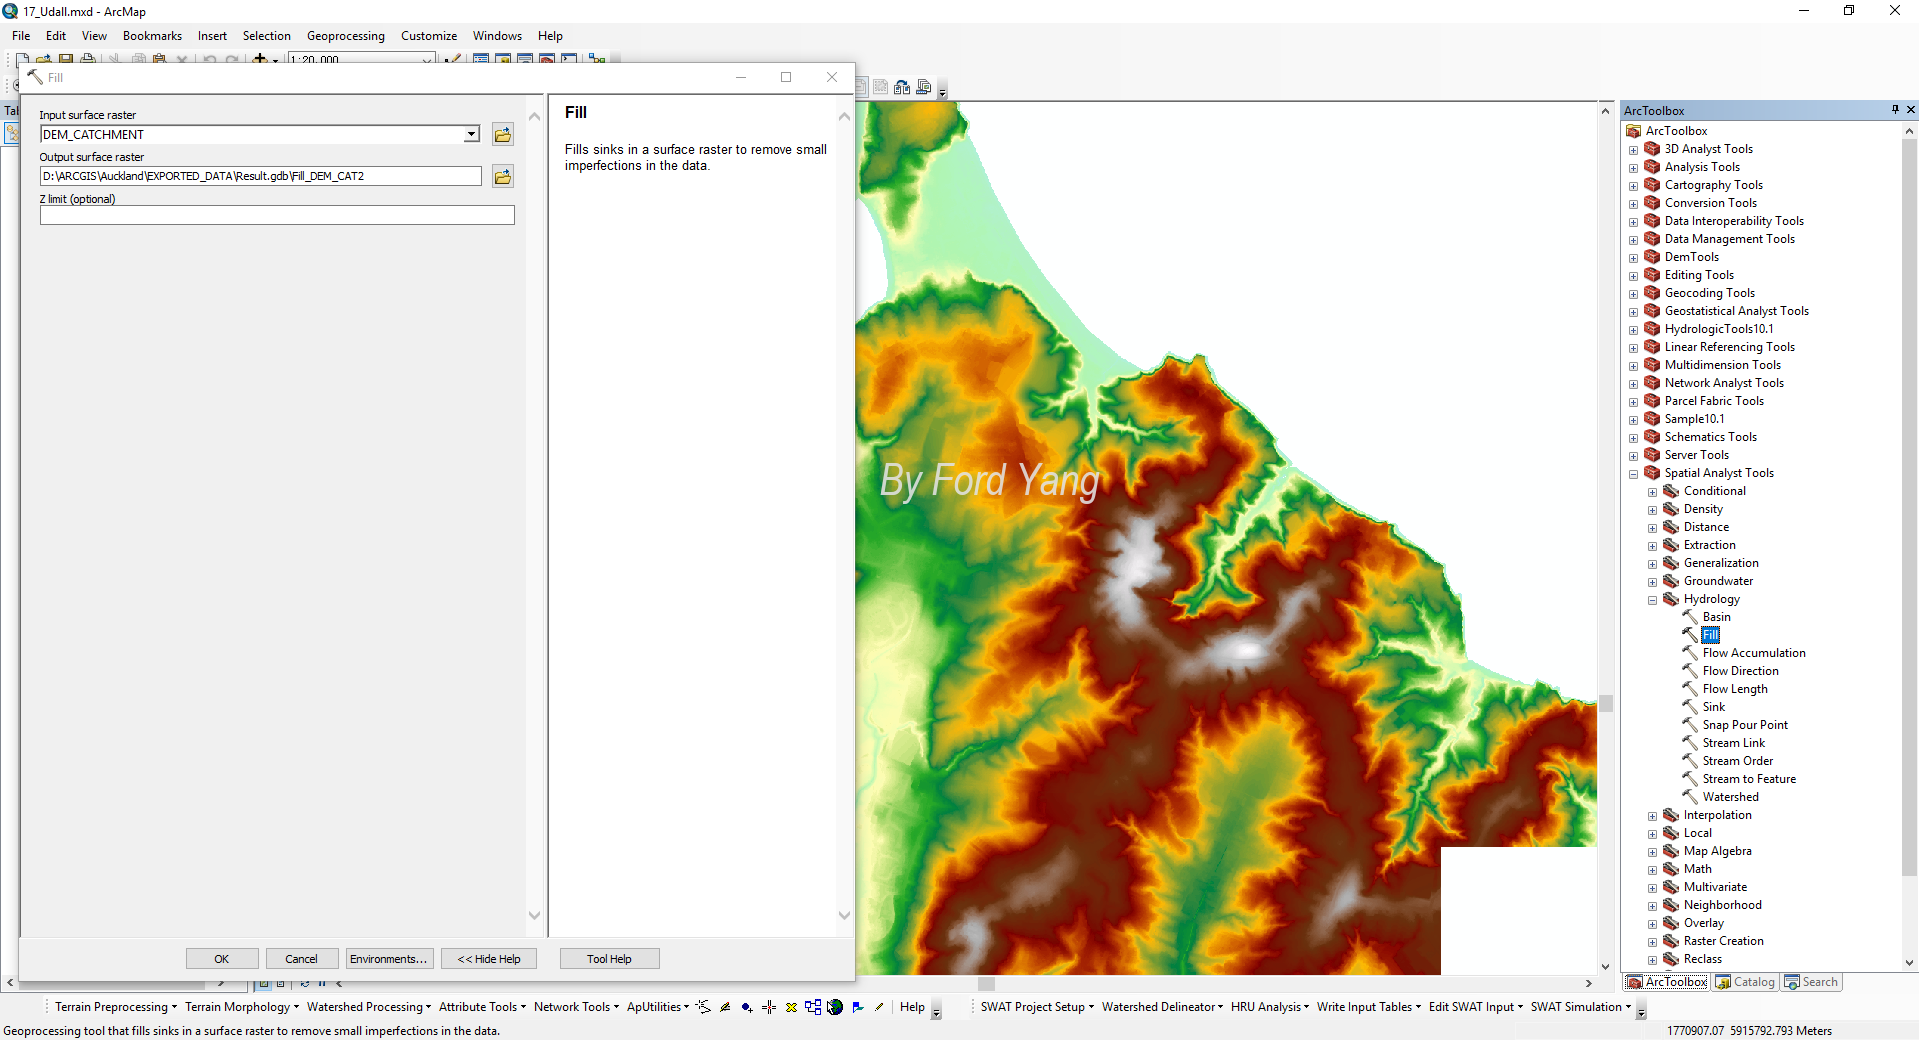
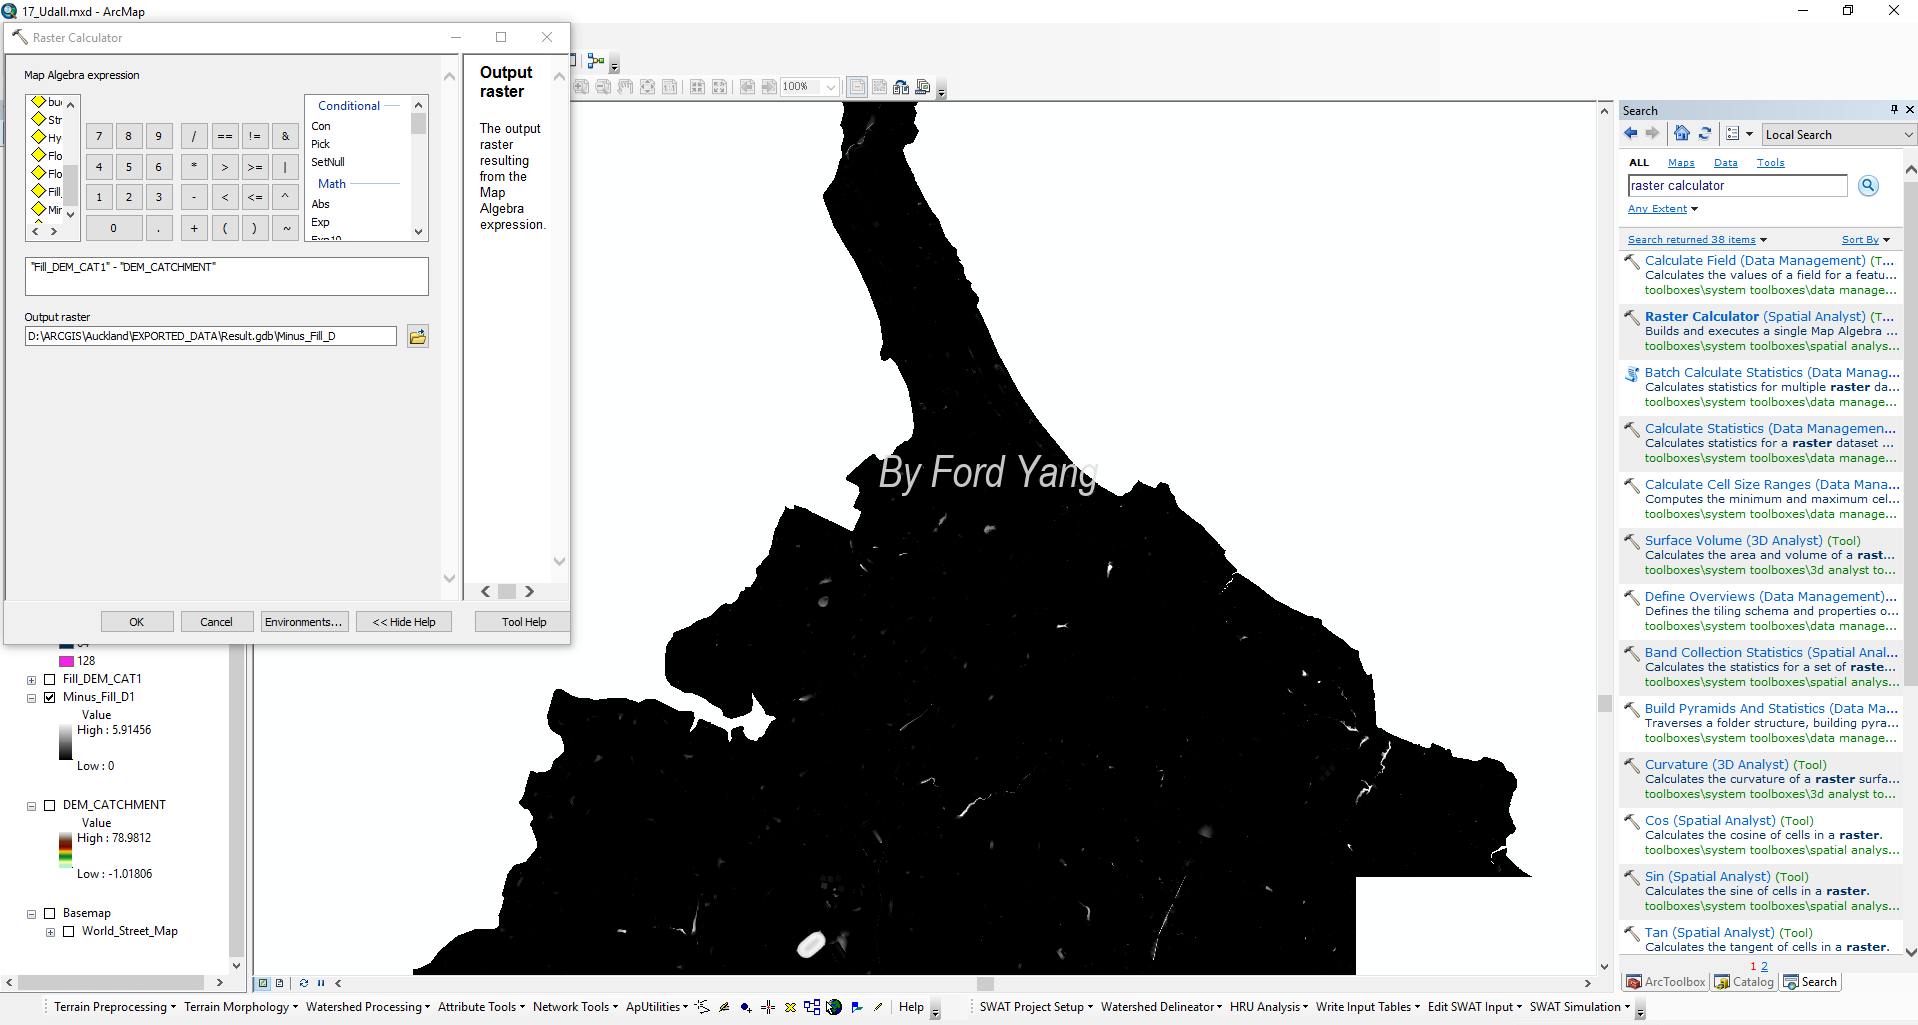
Then a new DEM data will be generated, it seems that there is no difference between the two raster datasets. But we can select the Arctool boxes\Spatial Analyst Tools.tbx\Map Algebra\Raster Calculator and calculate the difference between the two DEM datasets.
Flow Direction
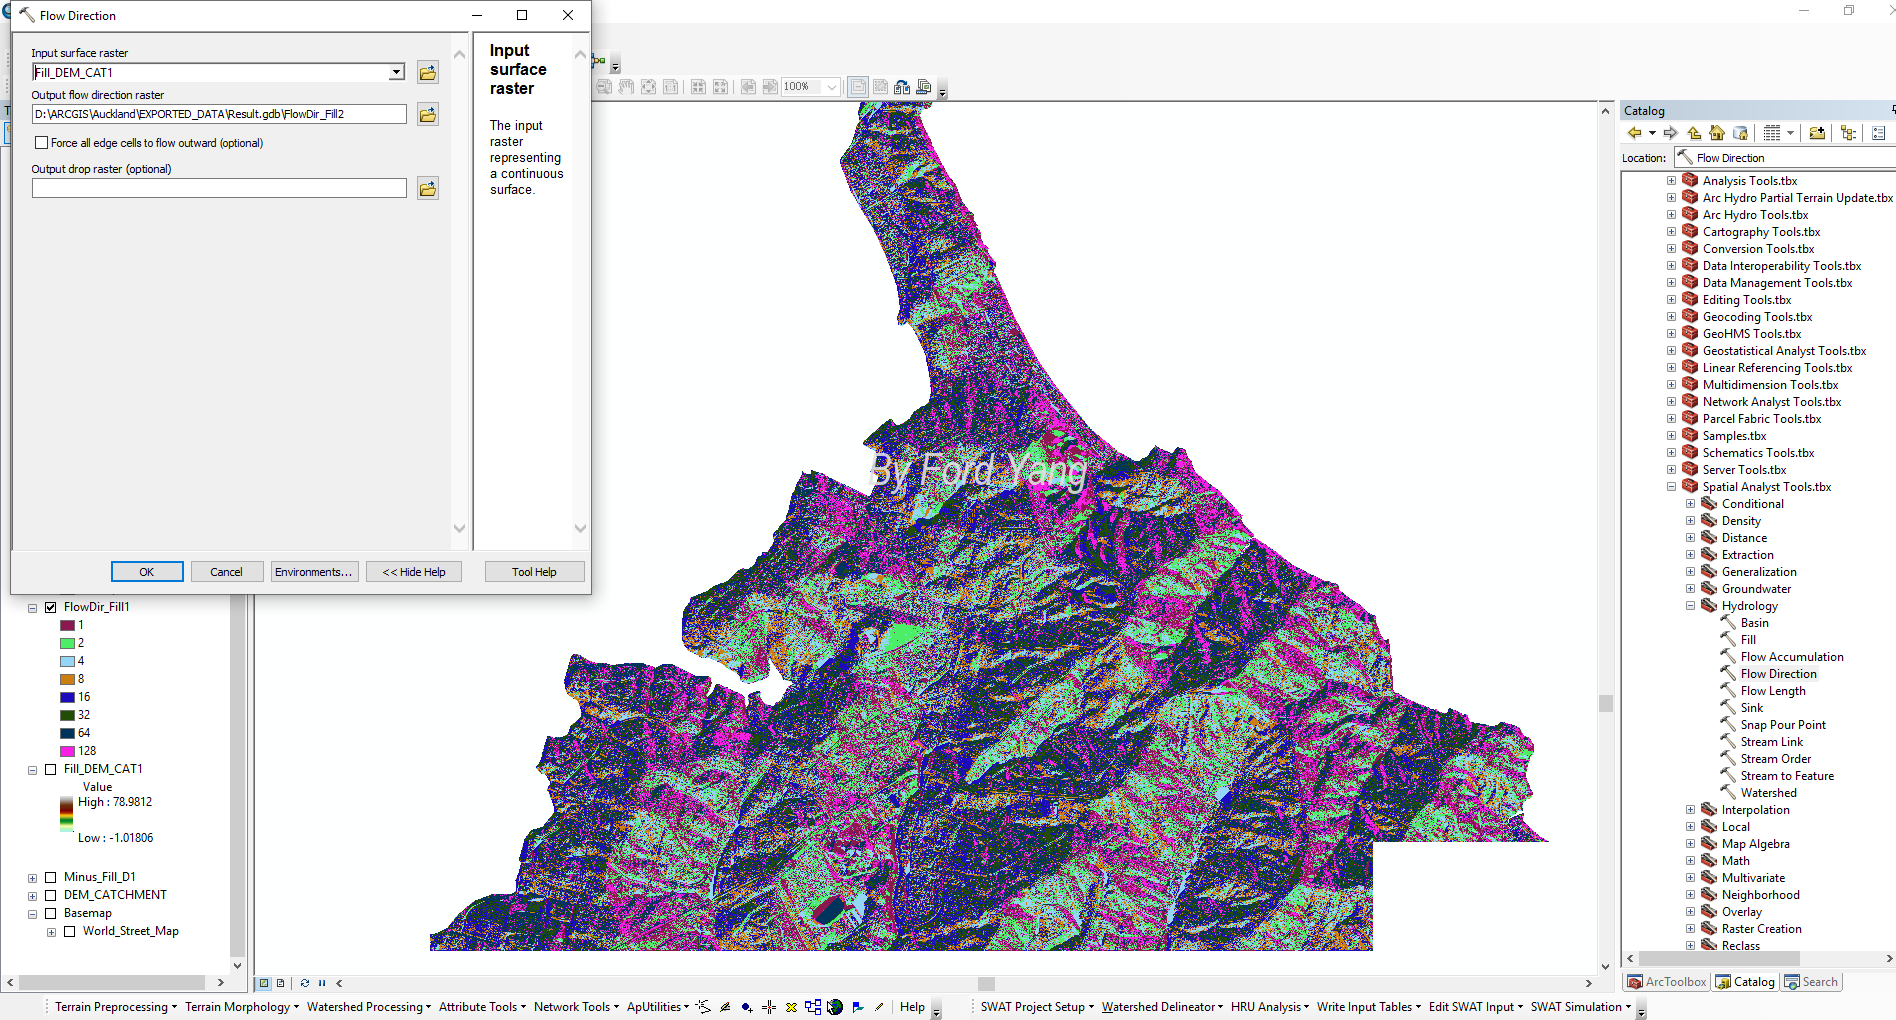
The we can click Flow direction and apply the filled DEM dataset.
The result is as shown below.
Flow Accumulation
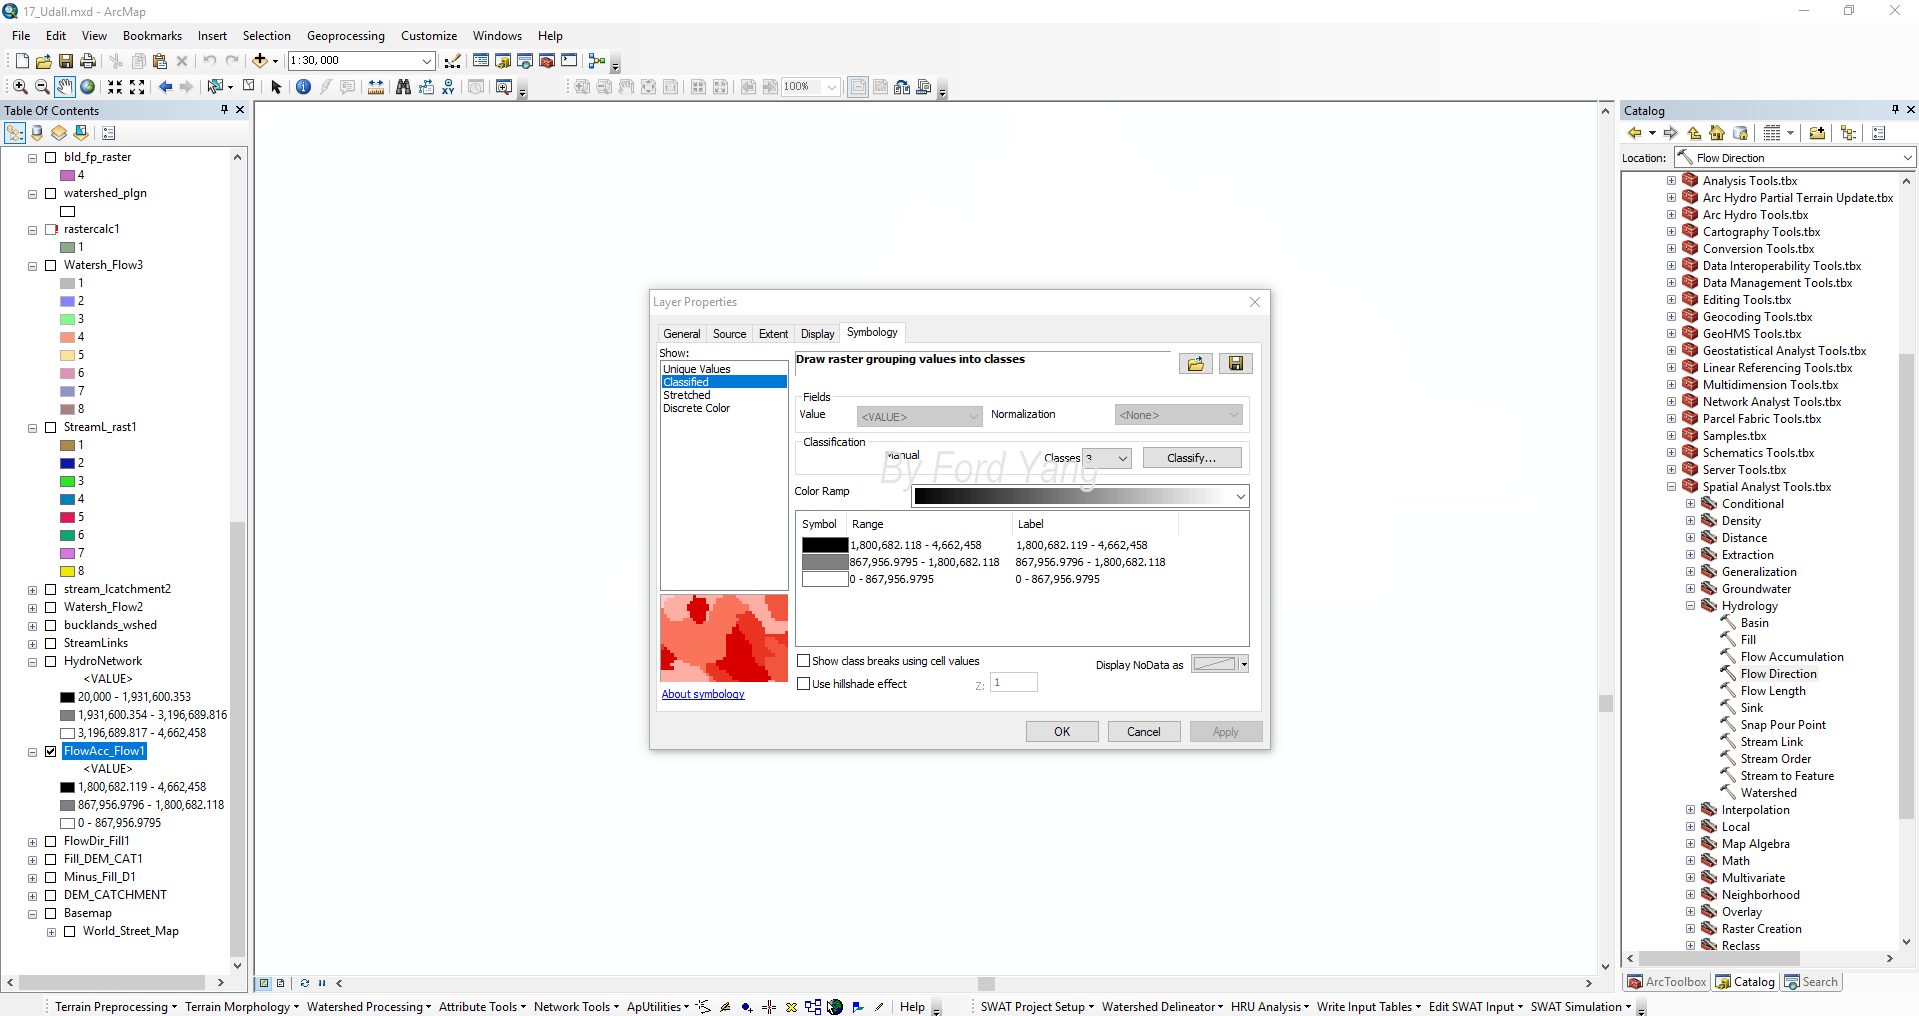
Similarly, we choose Flow Accumulation and select the datasets Filled DEM and Flow Accumulation, then the raster of flow Accumulation will be generated.
But we do not need to care about those raster with small No. of accumulation. We need to classify the result to select the data we are interested.
Flow Length
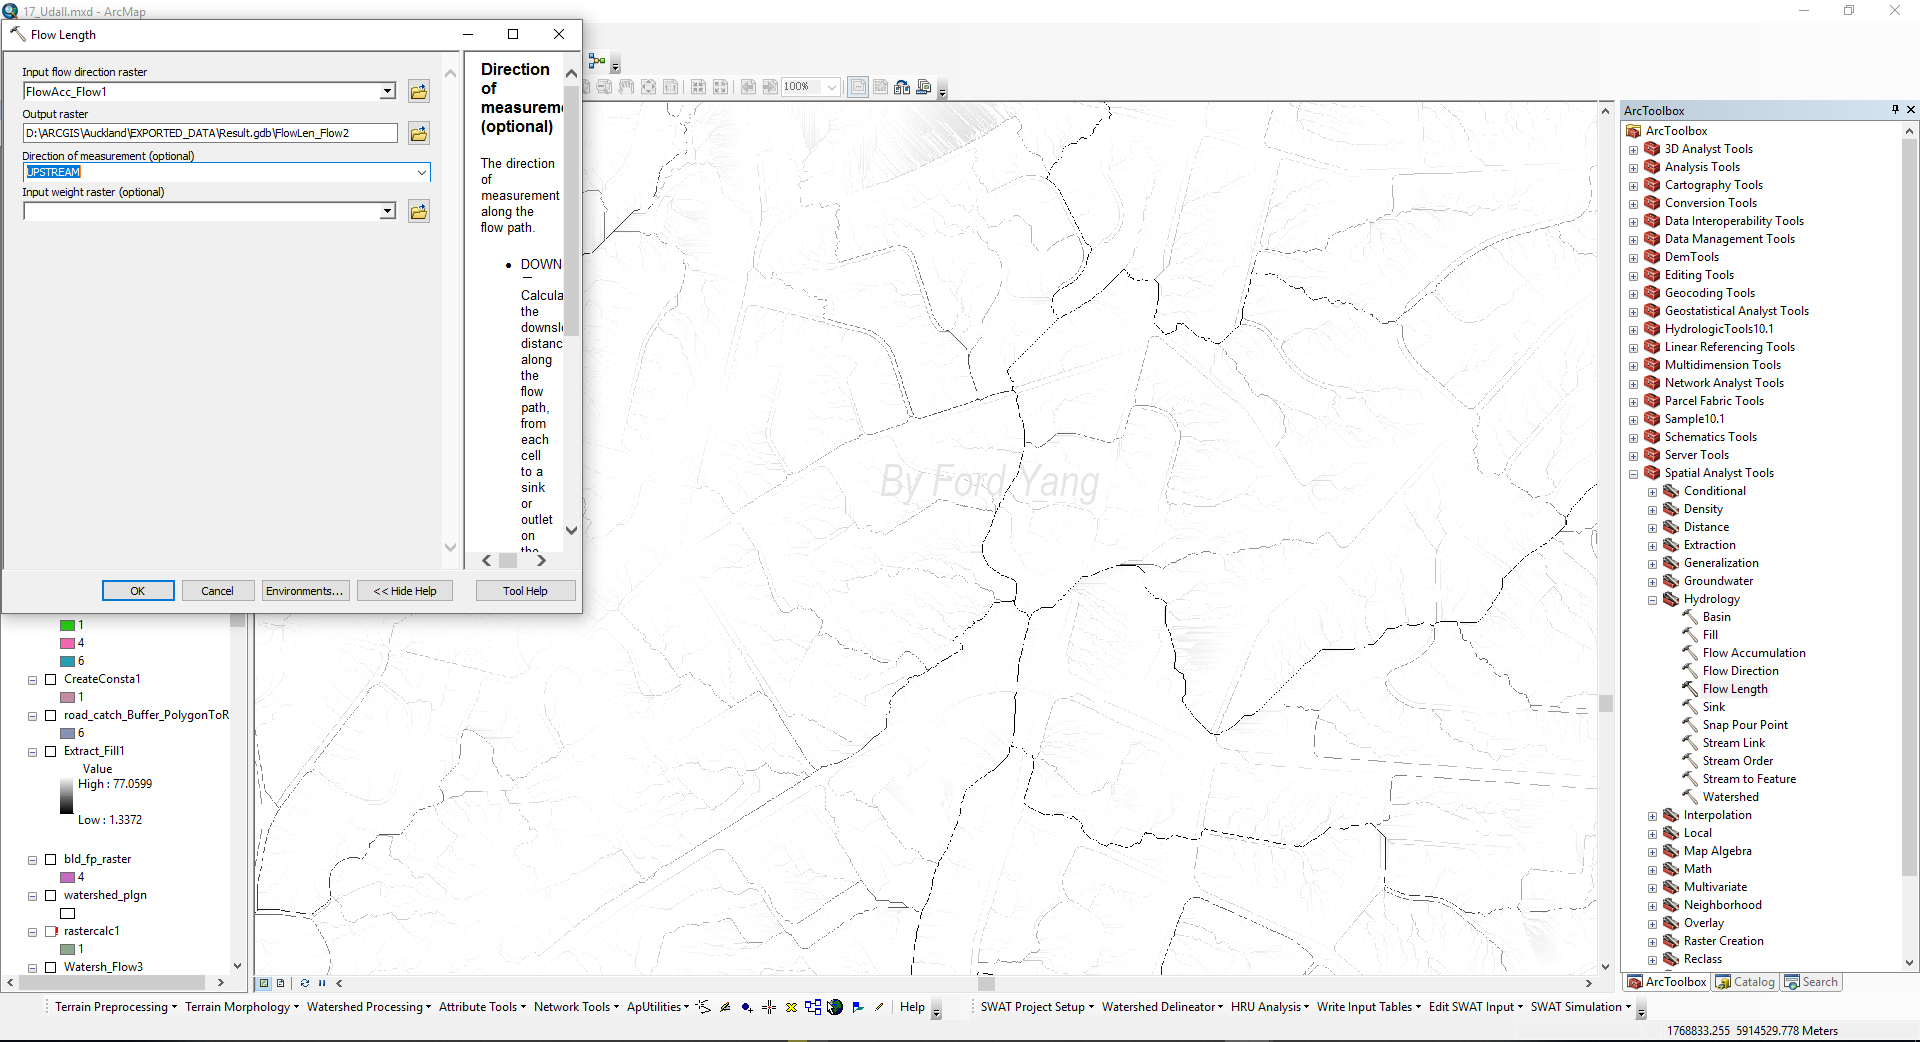
Flow Length is an important factor to calculate the catchment time of concentration(tc) , we choose Flow Length tool and select the datasets from Flow Accumulation, then we can get a raster map of concentration.
If we choose downstream, each raster value will record the length to the discharge point.
Reclassify
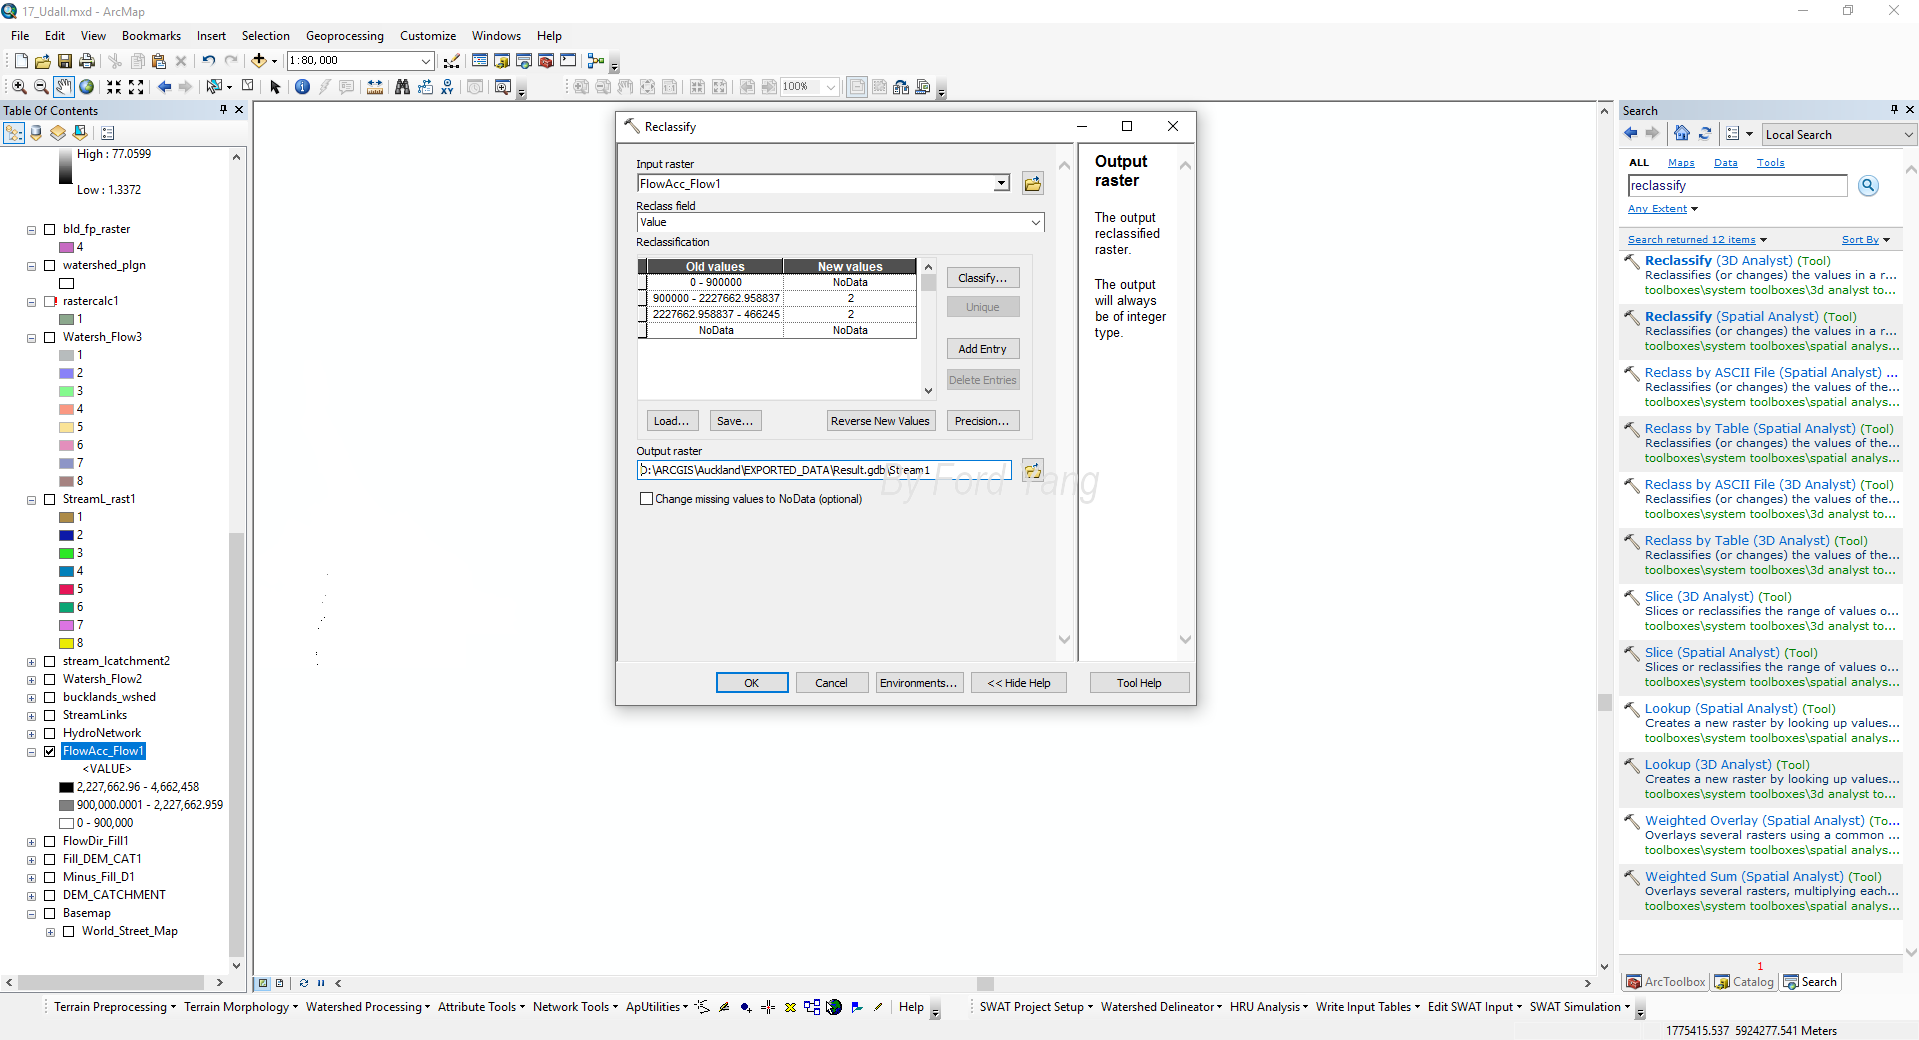
We assume the line with catchment of over 900,000 m2 will have apparent stream flow. We choose Arctool boxes\3D Analyst Tools.tbx\Raster Reclass\Reclassify.
Stream Link
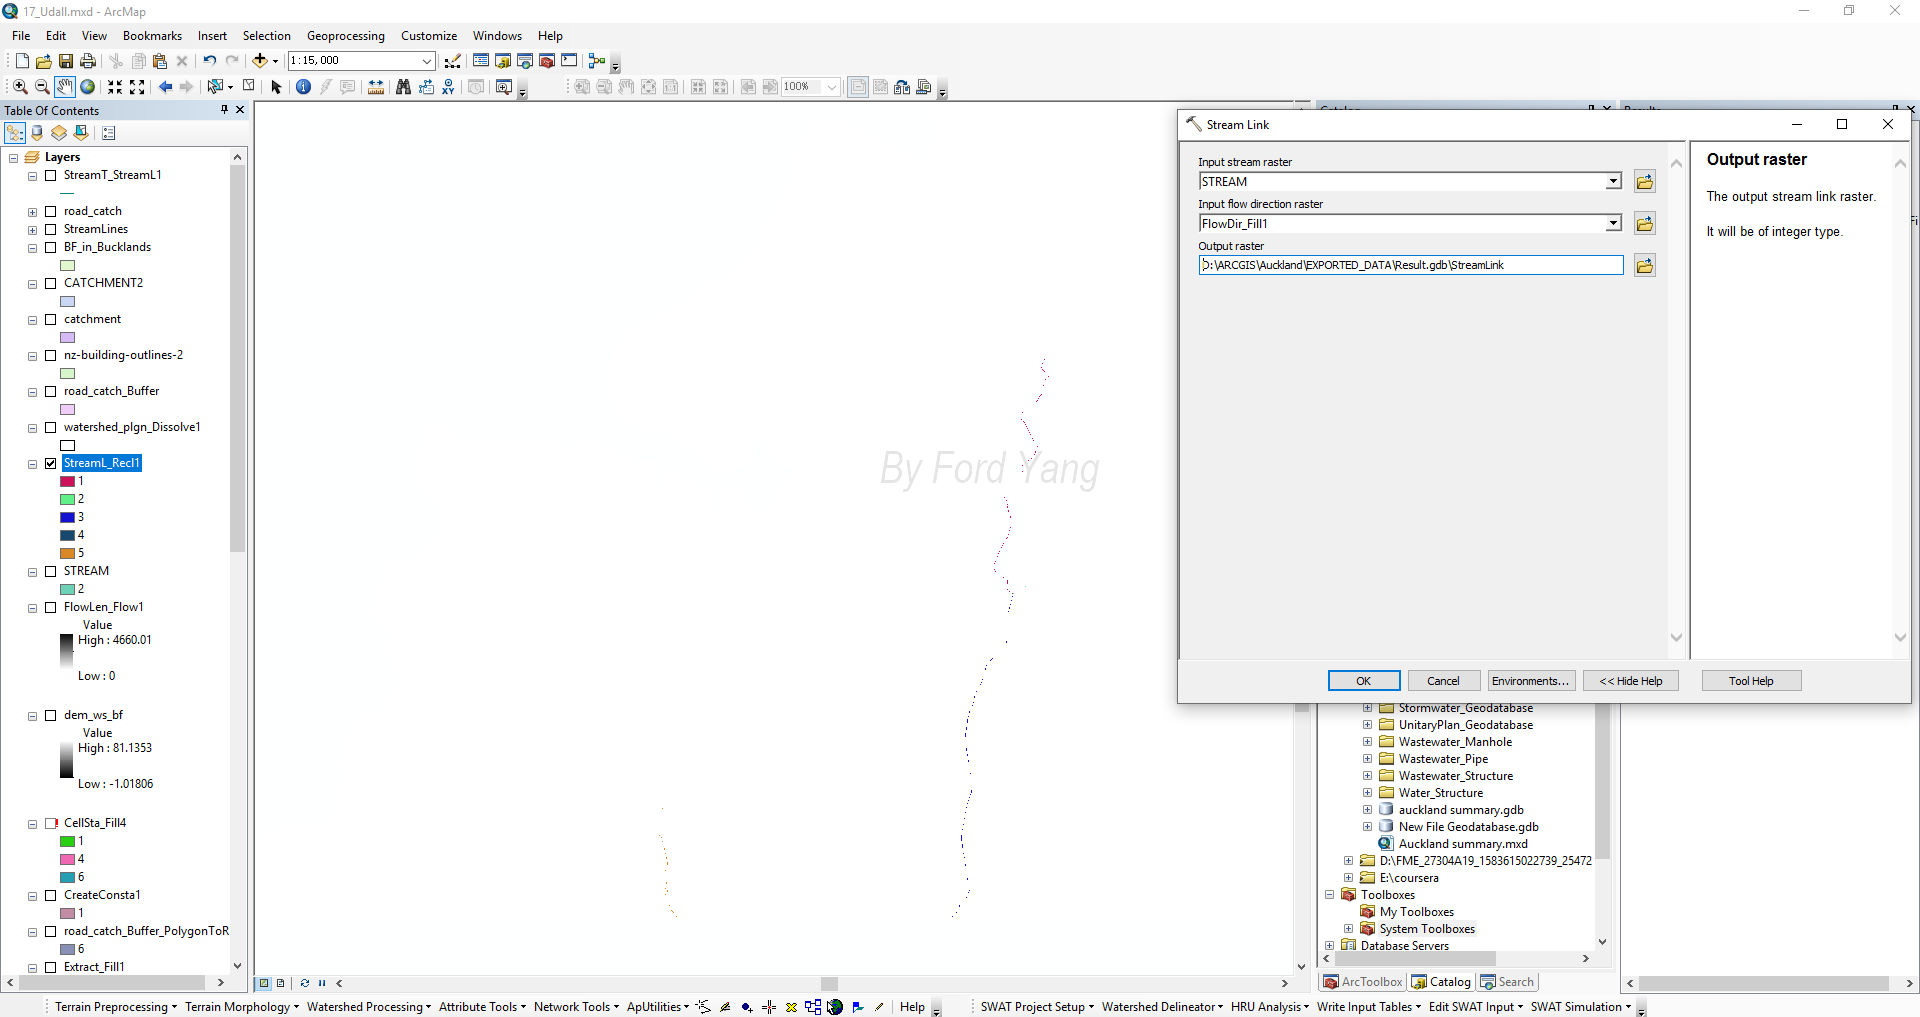
After reclassifying, we can get the discharge link with large catchment of over 900000 square meter.
Watershed
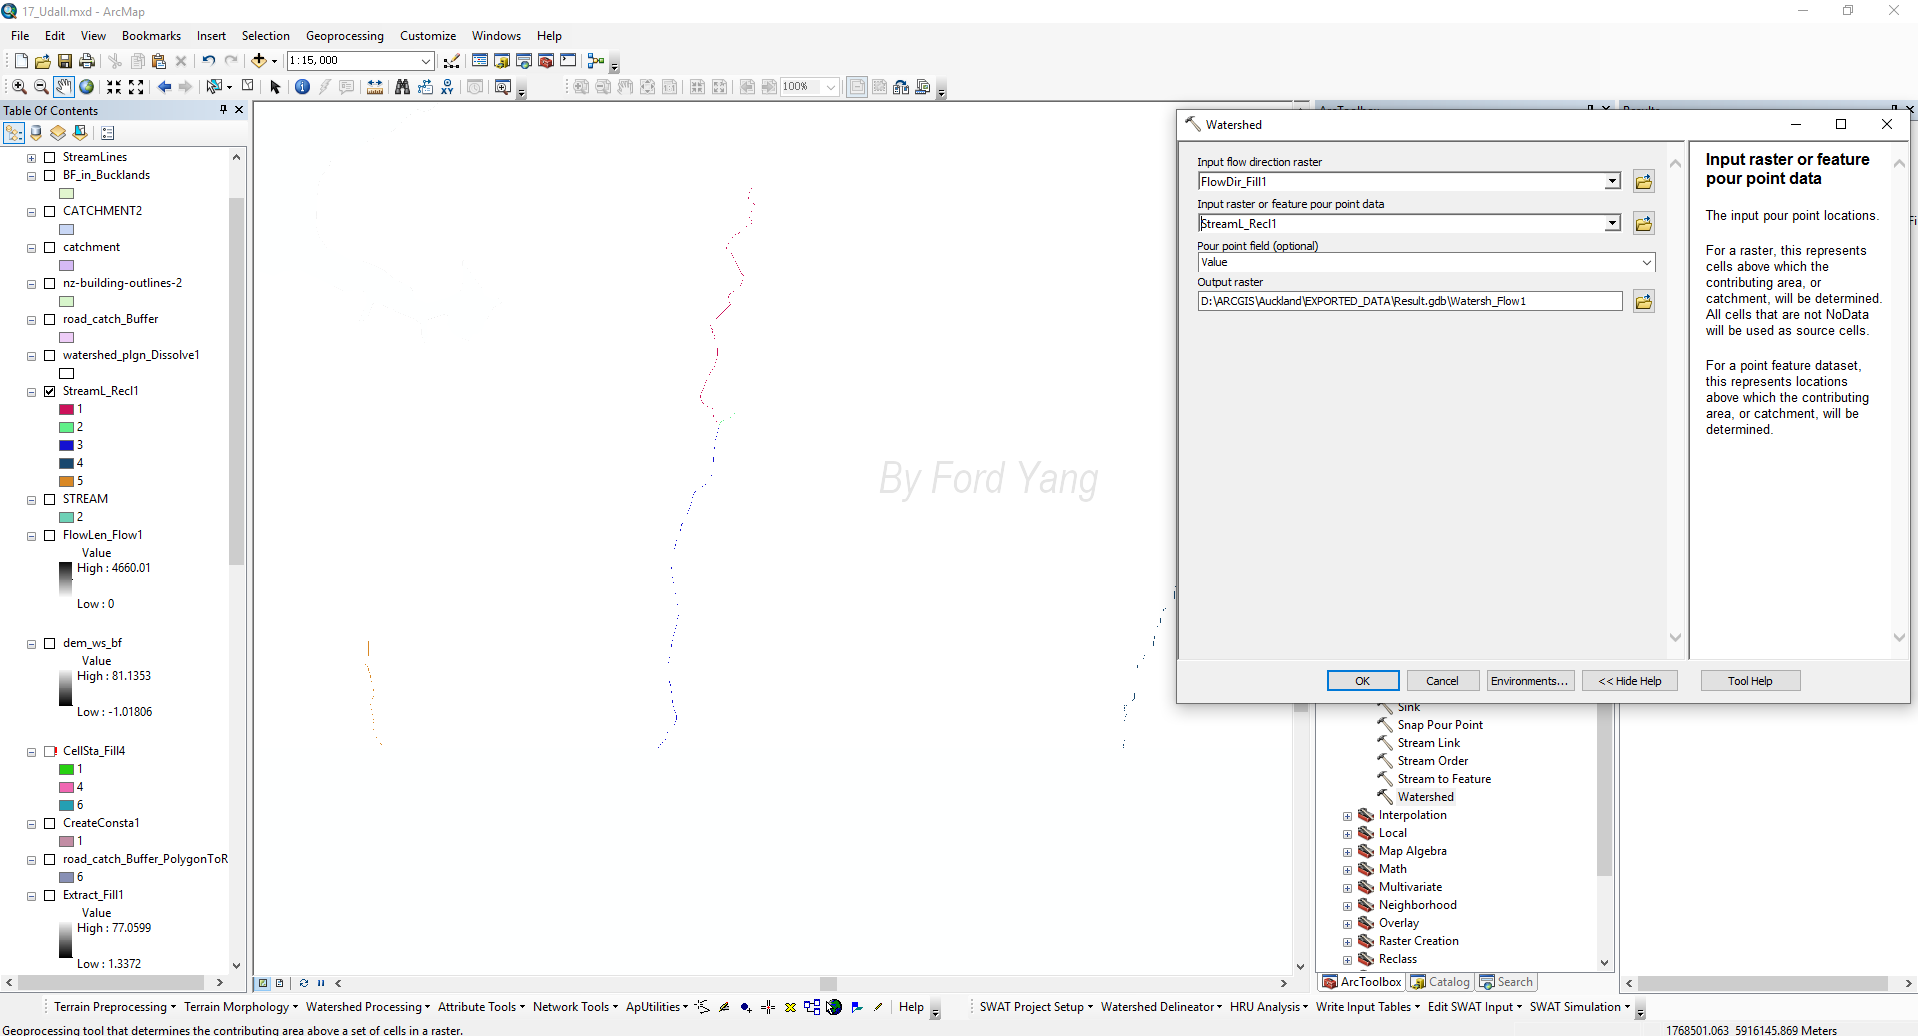
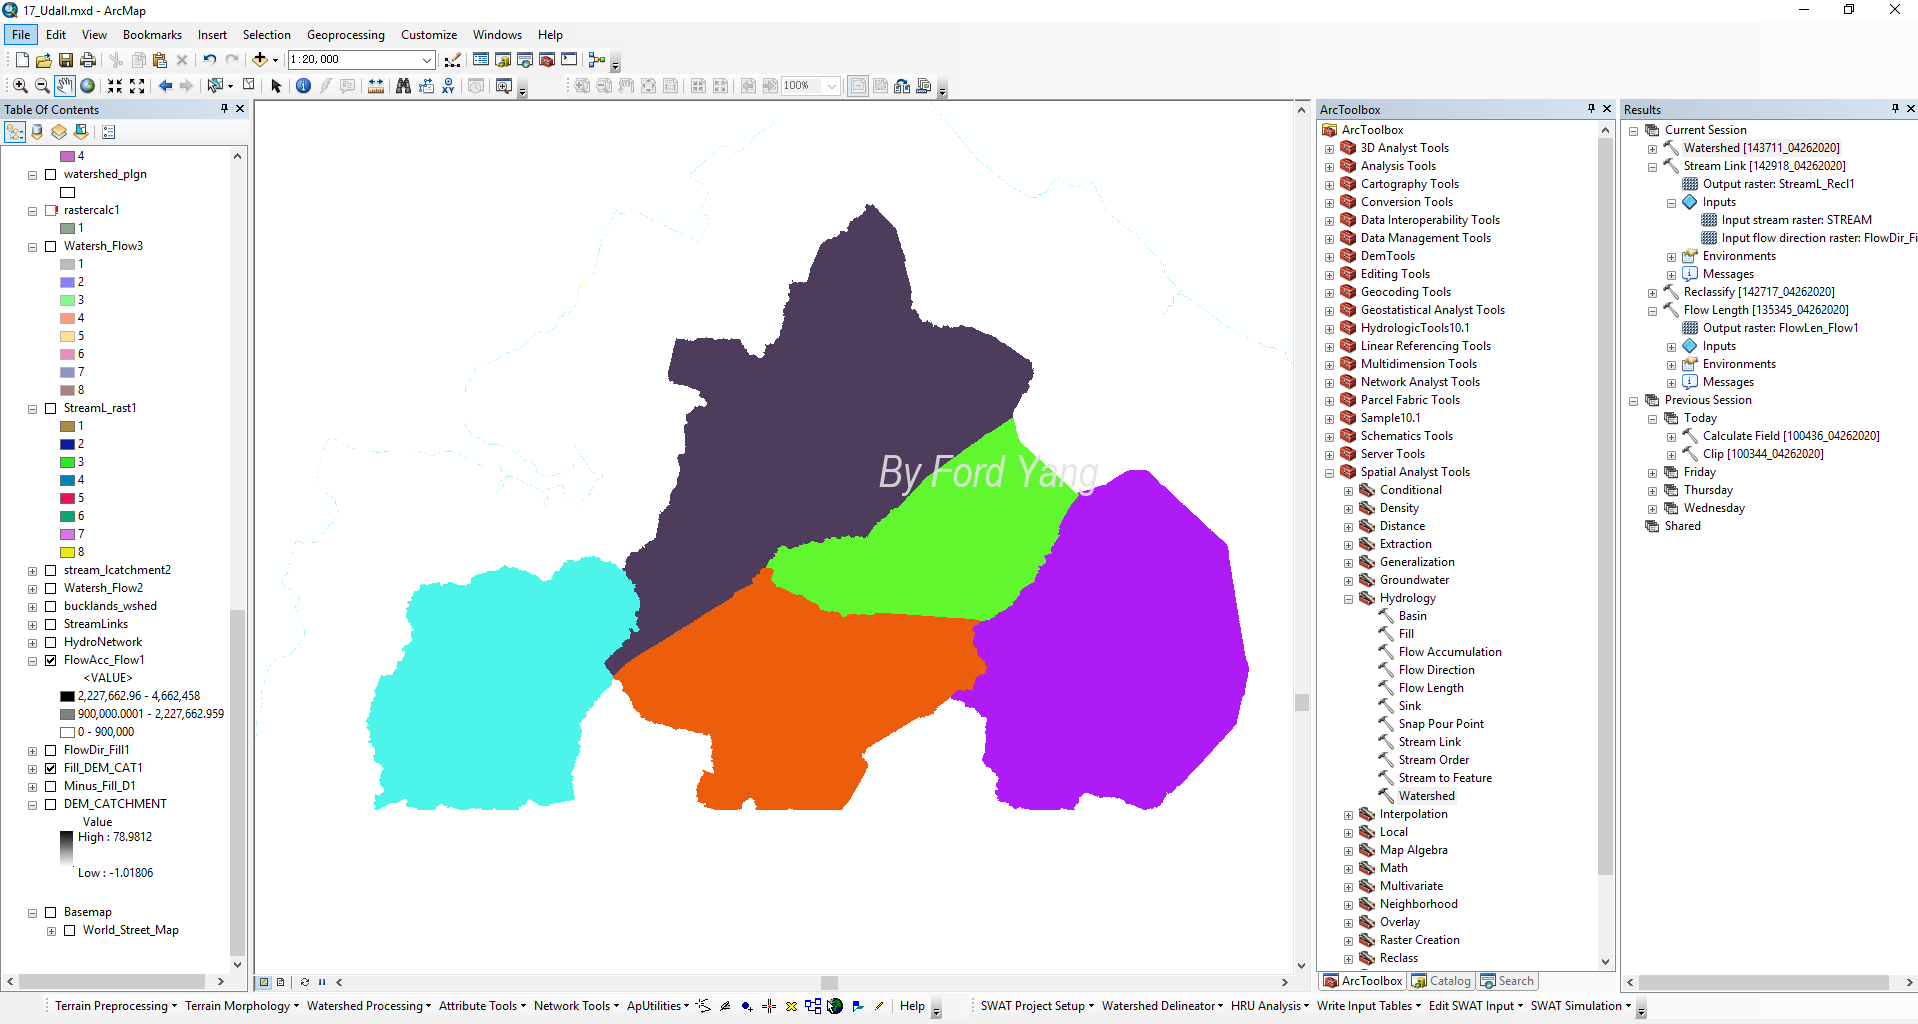
we choose Watershed and select the corresponding data from datasets, then we can get a raster map of watershed. We can use Arctool boxes\Conversion Tools.tbx\From Raster\Raster to Polygon to change to result to polygon.
We can also input point data for Input raster or feature pour point data, this will be useful when we have the stormwater discharge point, like manholes.